


Traffic information supplier Inrix has stated from data that it has gathered that drivers across the UK will spend on average 31 hours in traffic jams each year. All of this traffic will be costing motorists £1,168 when the amount of fuel and time wasted is taken into account, as well as because of higher freighting fees.

“There is no silver bullet to sorting out congestion. Ring-fenced funding for improving England’s major roads from 2021 should help, but there also needs to be an emphasis placed on providing cheap, practical, reliable alternatives to the car — especially in urban areas,” observed Rod Dennis, a spokesperson at the RAC.
“In the meantime, urban planners should be looking at how we can maximise vehicle flow — looking at traffic light sequencings, reducing the amount of time roadworks are live on roads and seeing what impact reducing road space for vehicles is having on journey times.”
Might another solution be for British drivers to gain a better understanding of where and when is worst for traffic jams throughout the nation? To find out more, VW dealership Vindis has delved further into the problem…
Where’s particularly troublesome for traffic jams?
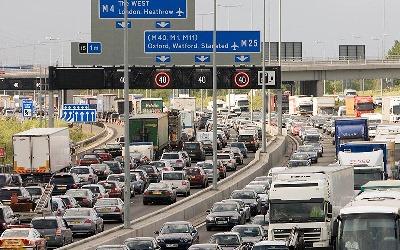
There’s a high probability that you’ll find yourself caught up in at least one traffic jam whenever you drive through London. According to the earlier mentioned data gathered by Inrix, the UK’s capital is the second most congested city across the whole of Europe, and drivers can face 73 hours each year in traffic.
It’s not just London where waiting times stretch into double figures, however. Manchester, Lincoln, Birmingham, Braintree, Aylesbury, Bath, Luton, and Guildford are all English destinations with waiting times between 25 and 40 hours. Motorists in Scotland won’t always have clear roads either, with those in Aberdeen and Edinburgh expected to lose 28 hours a year due to traffic jams at peak times, while in Wales the most congested city — with 24 hours per year of waiting times — is Newport.

We shouldn’t just focus on the level of traffic found in city centres when analysing how bad gridlock can be around the UK either. Some of the worst instances of congestion can be found on motorways and major routes on outskirts as drivers complete their commute. Therefore, here’s the UK’s top 10 most congested roads, again gathered by Inrix:
- A406 Northbound, Chiswick Roundabout to Hanger Lane, London. Drivers can expect to lose 73 hours per year on this route.
- A2 Eastbound, New Cross Gate to Prince Charles Road, London. Drivers can expect to lose 62 hours per year on this route.
- A3211 Eastbound, Westminster Bridge to London Bridge, London. Drivers can expect to lose 57 hours per year on this route.
- A102 Northbound, A2/Kidbrooke to Blackwall Tunnel, London. Drivers can expect to lose 51 hours per year on this route.
- A4200 Southbound, Russell Square to Aldwych, London. Drivers can expect to lose 50 hours per year on this route.
- A1 Southbound, College Gardens to Wallace Park, Belfast. Drivers can expect to lose 49 hours per year on this route.
- A308 Eastbound, Putney Bridge Approach to Sloane Square, London. Drivers can expect to lose 46 hours per year on this route.
- A431 Westbound, Bryants Hill to Lawrence Hill, Bristol. Drivers can expect to lose 45 hours per year on this route.
- A24 Northbound, Ormeau Road to Ann Street, Belfast. Drivers can expect to lose 45 hours per year on this route.
- A6 Northbound, Macclesfield Road to Heaton Lane, Manchester. Drivers can expect to lose 44 hours per year on this route.
When’s particularly troublesome for traffic jams?
Driving during the rush hour should be avoided unless your journey definitely cannot be put off until a quieter time of the day. Highlighting this point is car insurance experts Admiral, which compared the travel time of routes into various major city centres for a 9am arrival on a Monday morning when compared to 9am on a Sunday morning.
In Cambridge, 72 additional minutes can be placed onto a journey that is completed in rush hour as opposed to the same route being travelled along during the quietest time of the week. This saw the city take top spot in the study, followed by Leeds (51 extra minutes) and Manchester (47 additional minutes). The full top 10 is as follows:
- Cambridge — 72 extra minutes for a rush hour journey.
- Leeds — 51 extra minutes for a rush hour journey.
- Manchester — 47 extra minutes for a rush hour journey.
- Sheffield — 46 extra minutes for a rush hour journey.
- Edinburgh — 45 extra minutes for a rush hour journey.
- Birmingham — 43 extra minutes for a rush hour journey.
- Bristol — 43 extra minutes for a rush hour journey.
- Cardiff — 41 extra minutes for a rush hour journey.
- Aberdeen — 38 extra minutes for a rush hour journey.
- London — 38 extra minutes for a rush hour journey.
City centres are far from the only places in the UK where traffic can prove very troublesome during rush hour mind. Major roads which may not be situated in urban areas should also be factored into this. Once more, Admiral is on hand as they conducted research to find the UK’s most congested routes.
The journey from Dartford to Trafalgar Square around London has been found to be the UK’s most congested route, according to the research. Motorists can expect a staggering 225 per cent increase in driving time during the morning rush hour along this stretch of road. Romford to Trafalgar Square, again in London, didn’t fare much better, with driving time witnessing a 214 per cent increase throughout the morning rush hour.
How does the research look without London routes? The most congested routes throughout the UK become Chepstow to Cabot Circus in Bristol (a 200 per cent increase in driving time during the morning rush hour), Halton to St George’s Hall in Liverpool (a 192 per cent jump in driving time throughout the morning rush hour), and Washington to the Tyne Bridge in Newcastle (a 192 per cent hike in driving time in the morning rush hour).
“The figures do bring home the potential time that could be saved if you travel outside of peak times. If at all possible, consider starting your journey and working day earlier or later. It could mean your time is spent a lot more productively,” commented Admiral’s Motor Product Manager, Jo Cox.
Times of the year when traffic can be particularly bad
The level of traffic on the road can also increase considerably depending on the season. Around the 2017 festive break, for instance, following a survey of its drivers the RAC predicted that 1.25 million leisure trips would have been completed on Friday December 22nd 2017, 1.59 million on Saturday December 23rd, 1.87 million on Christmas Eve and a huge 5.3 million on Boxing Day.

In the first two weeks of the 2017 school holidays, the RAC was once again on hand to warn drivers about possible delays with their journeys. After an analysis of the travel plans of 3,176 motorists, the organisation predicted that they would have been 37 million leisure trips completed in the initial two weeks of the school holidays. This included 2.5 million journeys being made on the Friday that schools closed for the summer, 3.4 million on the Saturday and 2.8 million on the Sunday.

